Visualization in Medicine, Volcanology
and the Military
By Mike Boruta
_________________________________________________________________________________________________________________________
Telesurgery:
 Telesurgery,
also know and remote surgery, is a combination of cutting edge robotics,
communication technology and medical imaging technologies. It enables doctors
not only to operate on patients half a world away but allows patients to access
the very best doctors without traveling to another country.
Telesurgery,
also know and remote surgery, is a combination of cutting edge robotics,
communication technology and medical imaging technologies. It enables doctors
not only to operate on patients half a world away but allows patients to access
the very best doctors without traveling to another country.
It also allows for more accurate and less invasive procedures because, among other things, the surgeon operates on the patient through the use of several joysticks. These joysticks can be calibrated so that they are not very sensitive, meaning that if the doctor moves the joystick to the right 1 centimeter, the robot arm associated with that controller can potentially move 1 millimeter. This eliminates the list of complications that can be caused by a surgeon’s occasional hand tremors and thus makes “going under the knife” safer.
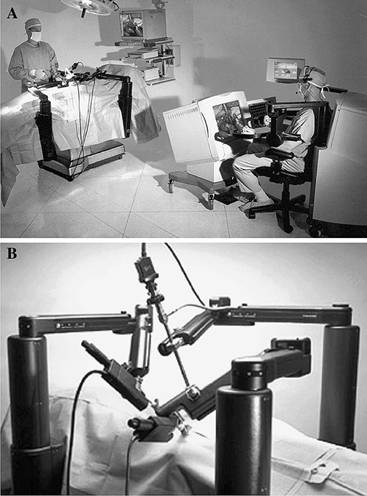
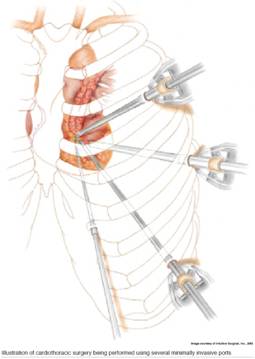
In addition, the doctor experiences less fatigue while operating on a patient remotely because instead of standing for an hour or so bent over an operating table he can sit down, watch a few screens and move a few joysticks around. So what is on these screens? Live 2D and 3D imagery from the endoscope in the patient’s body, recent MRI/CAT scan images, real time x ray (fluoroscopic) images of the patient with the positions of your probes clearly visible. To the right we can see the endoscope (the bottom-most probe) along with the 3 other probes used to perform the actual procedure. Only 4 incisions have to be made to fit the probes, it really is minimally invasive.
Zeus (seen to the right as well the
left) is a type of telesurgery robot that facilitated
Operation 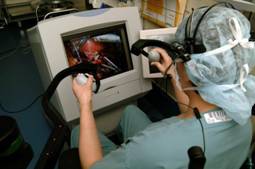 Lindbergh (2001), the first telesurgery
to occur over a long distance (New York to France). Recent advances in highspeed fiberoptics made it
possible, since using traditional data transfer methods would result in too
much of a delay between the doctor’s movement of the joystick and the responds
of the robot.
Lindbergh (2001), the first telesurgery
to occur over a long distance (New York to France). Recent advances in highspeed fiberoptics made it
possible, since using traditional data transfer methods would result in too
much of a delay between the doctor’s movement of the joystick and the responds
of the robot.
Future of Telesurgery:
The future of telesurgery is an uncertain one, there are two other robots like Zeus (Aesop and Hermes), all are similar in terms of operation and all have been field tested so why aren’t we seeing one at our local hospital? There are many reasons, ranging from the need to create new protocols and worldwide standards to the necessity of having an anesthesiologist and a surgeon on standby, but chief among them is lack of government funding. Until the financial support is there we won’t see this industry expanding into mainstream medical practice any time soon.
_________________________________________________________________________________________________________________________
Visualization in the Prediction of Volcanic Eruptions:
There are many different indicators
Volcanologists use to predict if a Volcano is going to erupt soon, ranging from
seismic activity in the area to the past history of the Volcano to even the
ground temperature of the mountain. Another indicator scientists take into
consideration is ground swelling; using very sensitive equipment Volcanologists
can measure ground swelling, areas that are “bulging out” most likely have lava
is accumulating underneath their surface at a very high pressure. By taking
measurements and putting them on a map, scientist can 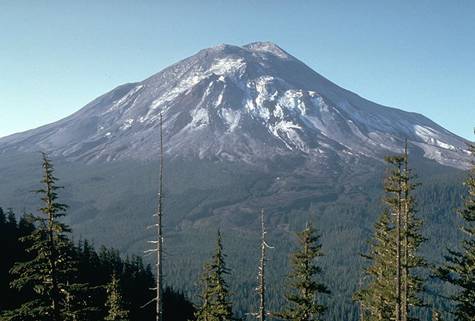 better determine the
direction, time and place of the explosion.
better determine the
direction, time and place of the explosion.
Mt. St. Helens:
St. Helens, Washington, erupted in 1980, and was the most deadly and costly eruption in the U.S. to this date. Significant ground swelling was detected along the northern side shortly before the mountain erupted, the side that eventually slid off the mountain. To the left we see the mountain a few days prior to the eruption, the right a few days after. Notice that the northern side of the mountain has experienced a lot more damage than the others.
But, just because the Volcano erupted doesn’t mean that ground swelling has stopped. The little dome that you see in the right picture has been expanding quite rapidly, especially in the first 6 years after the eruption:
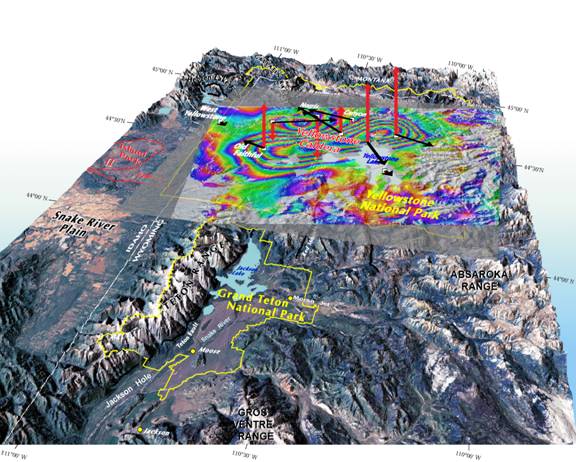
Yellowstone Caldera:
A caldera is a cauldron like feature, similar to the crater you see in the Mt. St. Helens picture but much less pronounced and spread over a much larger area. The one in Yellowstone is very big but, according to some scientists, isn’t expected to erupt any time soon. In any case, Yellowstone has been experiencing ground swelling since people first started to take measurements, with the current average annual increase in elevation being 1.5 cm. A map illustrating this is seen below:
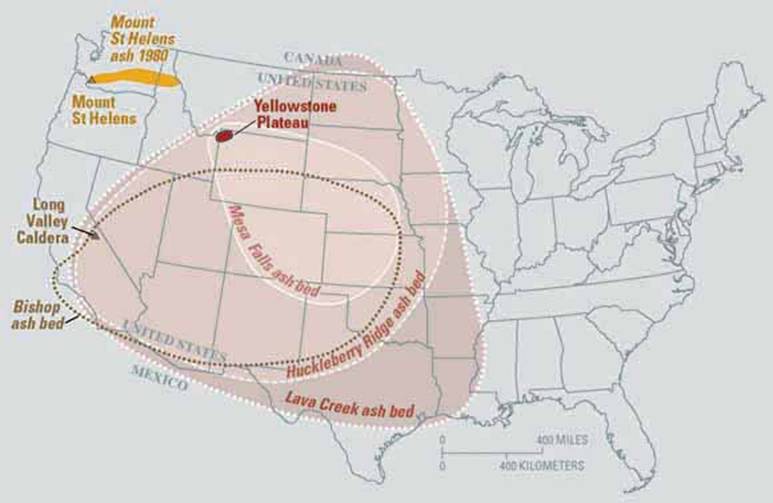
And what would be the impact on the United States if Yellowstone would blow its top? Below you can see the ash deposits from previous Yellowstone eruptions contrasted with Mt. St. Helens, roughly half of the continental U.S. would be covered in ash, including our “bread basket” states like Iowa. In addition such an explosion would put so much debris into the air that it would potentially block out the sun, causing a nuclear winter in which global temperatures would plummet and a majority of plant life would die out.
_________________________________________________________________________________________________________________________
Visualization in the Military: Battlefield Awareness
and CPOF
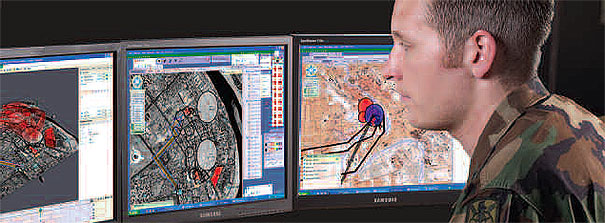
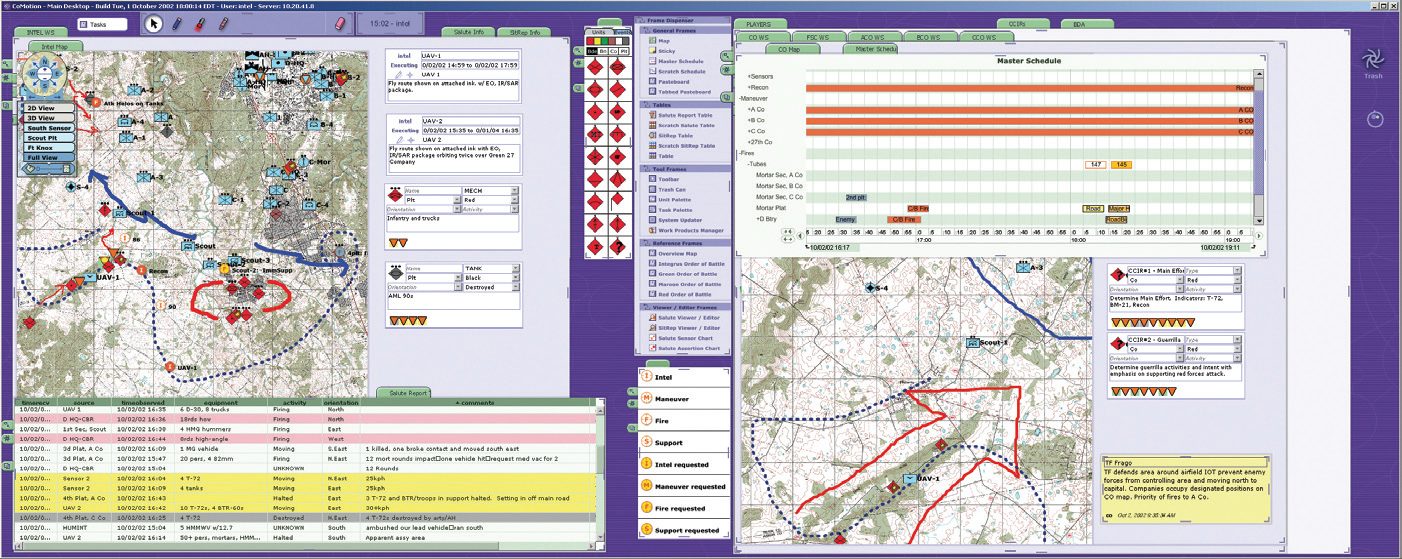
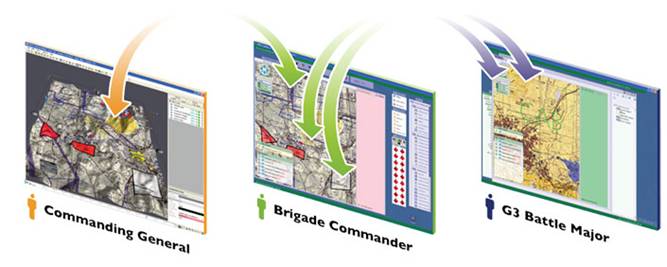 CPOF stands for “The Command
Post Of the Future” and is a software system designed
to greatly increase the speed and quality of command decisions. By using
networked visualization systems this software system helps display a mass of
information clearly and in real time, such as location of troops and enemies,
ground terrain, objectives etc. It has an easy to use interface that allows for
commanders and grunts alike to view 2D and 3D maps of the battlefield, to drag
and drop units, announce new objectives and draw on the map to illustrate what
the mission is. All of the above can be seen in real time, allowing for
unprecedented communication and collaboration between commanders and the troops
on the ground and thus give both a much better view and understanding of the
battlefield, locations of friendly’s and enemies etc. Because live data is
displayed this software system is also an ideal replacement for the boring,
static PowerPoint presentations that are so common place in the military
nowadays; instead the commander can come in to the room and present real-time
information, interact with the map and change objectives on the spot.
CPOF stands for “The Command
Post Of the Future” and is a software system designed
to greatly increase the speed and quality of command decisions. By using
networked visualization systems this software system helps display a mass of
information clearly and in real time, such as location of troops and enemies,
ground terrain, objectives etc. It has an easy to use interface that allows for
commanders and grunts alike to view 2D and 3D maps of the battlefield, to drag
and drop units, announce new objectives and draw on the map to illustrate what
the mission is. All of the above can be seen in real time, allowing for
unprecedented communication and collaboration between commanders and the troops
on the ground and thus give both a much better view and understanding of the
battlefield, locations of friendly’s and enemies etc. Because live data is
displayed this software system is also an ideal replacement for the boring,
static PowerPoint presentations that are so common place in the military
nowadays; instead the commander can come in to the room and present real-time
information, interact with the map and change objectives on the spot.